We have compiled a list of manufacturers, distributors, product information, reference prices, and rankings for Information Visualization System.
ipros is IPROS GMS ・ IPROS One of the largest technical database sites in Japan that collects information on.

Information Visualization System - List of Manufacturers, Suppliers, Companies and Products | IPROS GMS

Information Visualization System Product List

1~4 item / All 4 items

Displayed results

Hangzhou Ground Improvement Construction Information Visualization System 【3D Pile Viewer】

Ground improvement work using ICT: Visualizing, accumulating, and utilizing invisible construction information within the ground.

This is a system that collaborates with construction management devices to guide the position of piles, visualize and record improvement bodies and construction information. By collecting various construction information in the cloud and sharing it over the internet, it contributes to the management of ground improvement and pile construction, quality enhancement, and the efficiency of report creation. The acquired data is displayed in 3D on a web browser (K-Cloud). *Note: Some construction management devices may not be compatible. NETIS Registration KT-170030-VE Screen provided by Ando & Associates Co., Ltd. Site: Wonogiri Dam sediment control construction

  • 3D measuring device
  • Other information systems
  • Information Visualization System

Added to bookmarks

Bookmarks list

Bookmark has been removed

Bookmarks list

You can't add any more bookmarks

By registering as a member, you can increase the number of bookmarks you can save and organize them with labels.

Free membership registration

Storage/Delivery Temperature and Location Information Visualization Solution

IoT solution that visualizes temperature management during storage and delivery, as well as location information for pharmaceuticals and food products.

A visualization solution for storage/delivery temperature and location information is... When delivering products or equipment that require temperature management, it ensures the delivery of products to clients while maintaining quality. This is an IoT solution that enables temperature management. There has been a 80% cost reduction achieved by migrating from existing cloud services to Microsoft Azure. This system is adopted in the sales scenes of medical devices and pharmaceuticals. Since the degradation of quality in medical devices and pharmaceuticals directly impacts human life, thorough temperature management is essential. Products are delivered to clients from temperature-controlled warehouses through delivery personnel. By placing GPS and temperature sensors inside delivery coolers containing medical devices and pharmaceuticals, temperature management and tracking of delivery routes can be achieved. By visualizing this in the cloud, it contributes to preventing quality degradation and enhancing client trust.

  • Communications
  • Information Visualization System

Added to bookmarks

Bookmarks list

Bookmark has been removed

Bookmarks list

You can't add any more bookmarks

By registering as a member, you can increase the number of bookmarks you can save and organize them with labels.

Free membership registration

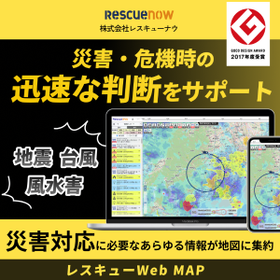
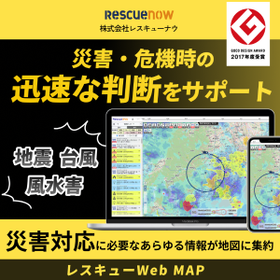
Rescue Web MAP | Consolidating managed properties, facilities, and risks on a map

Consolidate disaster and crisis information around managed buildings and facilities onto a single map! You can see at a glance which properties and facilities are affected.

Real estate and facility management that directly connects to the risks of power outages, water supply interruptions, and flooding for residents and tenants. Even if the building is intact, power outages or water supply interruptions may halt elevators and water supply and drainage systems, making quick verification of lifelines essential. However, it is difficult to grasp the situation of widely scattered managed properties manually, and delays in information gathering can directly lead to delays in response. With "Rescue Web MAP," you can quickly check on a map which properties or facilities are affected when a disaster occurs. By reducing the effort of gathering information and cross-referencing with each property, it supports faster decision-making related to initial responses, such as prioritizing inspections and determining the need for immediate action. 【Features】 - Alerts via email about disaster and crisis occurrence information. Also addresses "lifeline information" such as power outages and water supply interruptions. - Centralized understanding of risks such as river flooding and inundation. Useful for checking properties with underground facilities. - Displays hazard maps such as flood inundation risk areas, also useful for confirming property risks during normal times. - Automatically extracts properties in disaster-affected areas, available for download in Excel format. *For more details, please refer to the PDF document or feel free to contact us.

  • Other services
  • Information Visualization System

Added to bookmarks

Bookmarks list

Bookmark has been removed

Bookmarks list

You can't add any more bookmarks

By registering as a member, you can increase the number of bookmarks you can save and organize them with labels.

Free membership registration

Rescue Web MAP | Consolidating bases, agencies, and risks on a map

Consolidate disaster and crisis information around your company locations and agencies onto a single map! You can see the overall damage and the affected locations at a glance.

In the event of a large-scale disaster, the insurance industry is required to respond to a large number of claims in a short period of time. If the overall picture of the damage cannot be grasped, the initiation of damage investigations and payment systems will be delayed, making it essential to understand the situation immediately after the disaster occurs. However, it is difficult to manually grasp the conditions of widely scattered bases and agencies, and delays in information gathering can directly lead to delays in response. With "Rescue Web MAP," when a disaster occurs, you can quickly check on a map which bases or agencies are affected. By reducing the effort required to gather information and cross-reference it with each base, it supports the acceleration of decision-making related to the establishment of a response headquarters and the allocation of personnel for damage investigations. **Features** - Alerts via email for disaster and crisis occurrence information. Monitored by personnel 24/7. - For earthquakes of magnitude 5 or higher, the first report on the damage situation is provided 60 minutes after occurrence, and the second report 120 minutes later. - Visualizes the operational status of infrastructure (roads, electricity, water supply, communication) to confirm its impact on local response. - Automatically extracts bases and agencies in the disaster-affected area, available for download in Excel format. *For more details, please refer to the PDF document or feel free to contact us.*

  • Other services
  • Information Visualization System

Added to bookmarks

Bookmarks list

Bookmark has been removed

Bookmarks list

You can't add any more bookmarks

By registering as a member, you can increase the number of bookmarks you can save and organize them with labels.

Free membership registration